CoTrEx 2.0 overview
The Colon Transcriptome Explorer version 2.0 (CoTrEx 2.0) is an interactive resource
to explore transcriptomic features of human non-neoplastic colon tissue
and their association with germline genetic variants.
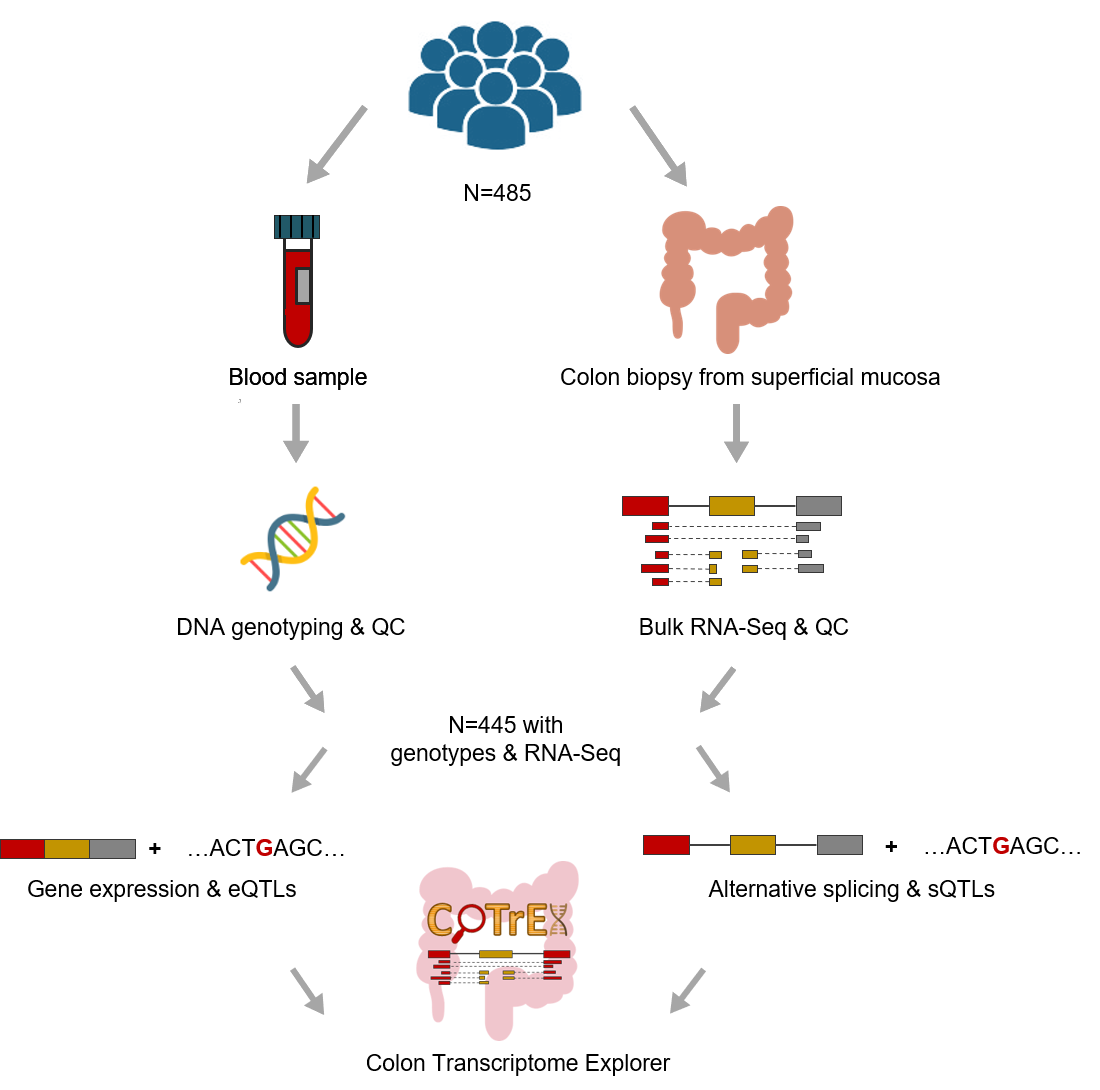
The data provided in CoTrEx 2.0 was obtained in large population-based studies, i.e., the
University of Barcelona and University of Virginia genotyping and RNA sequencing project
(BarcUVa-Seq)
and the
Genotype-Tissue Expression project
(GTEx)
version 8.
Summary of BarcUVa-Seq data.
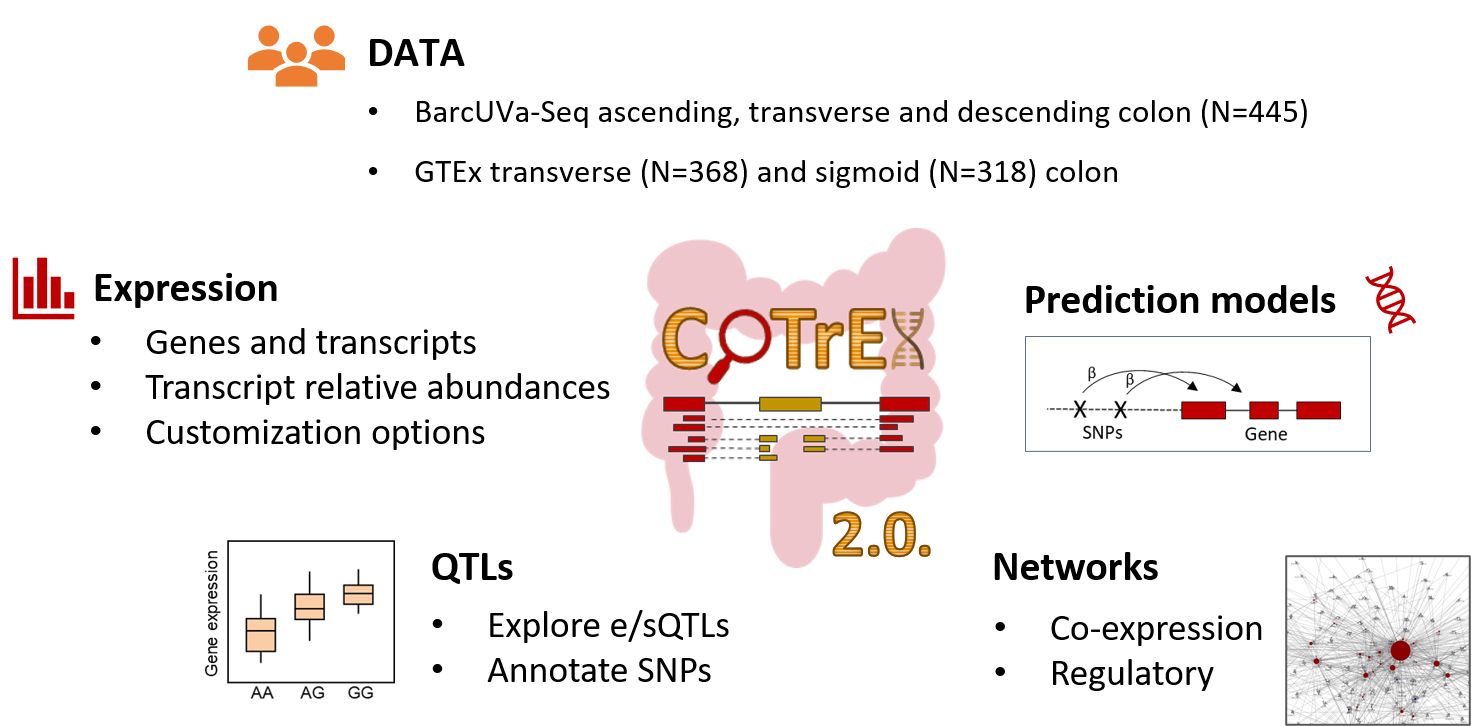
CoTrEx 2.0 facilitates searching for genes and transcripts of interest and visualizing their expression
levels in the colon in customizable plots. Users may browse colon expression and splicing quantitative
trait loci (e/sQTLs), as well as perform queries to obtain gene expression association statistics for SNPs of interest.
Also, CoTrEx 2.0 provides access to elastic net-based prediction models that allow imputing colon gene expression from SNP genotype data.
Finally, users may explore gene interactions with target and regulator genes, and patterns of
correlated expression in regulatory and gene co-expression networks, respectively.
CoTrEx 2.0 overview.
Using CoTrEx 2.0
Expression tab
Users may select a data set (i.e., BarcUVa-Seq, GTEx transverse or sigmoid colon)
and search for a gene using the search box on the left, and select the transcripts of interest.
Plots can be customized according to the options that appear by clicking the icon at their top left corner.
Also, input data can be filtered by covariates (i.e., sex, age and tissue location).
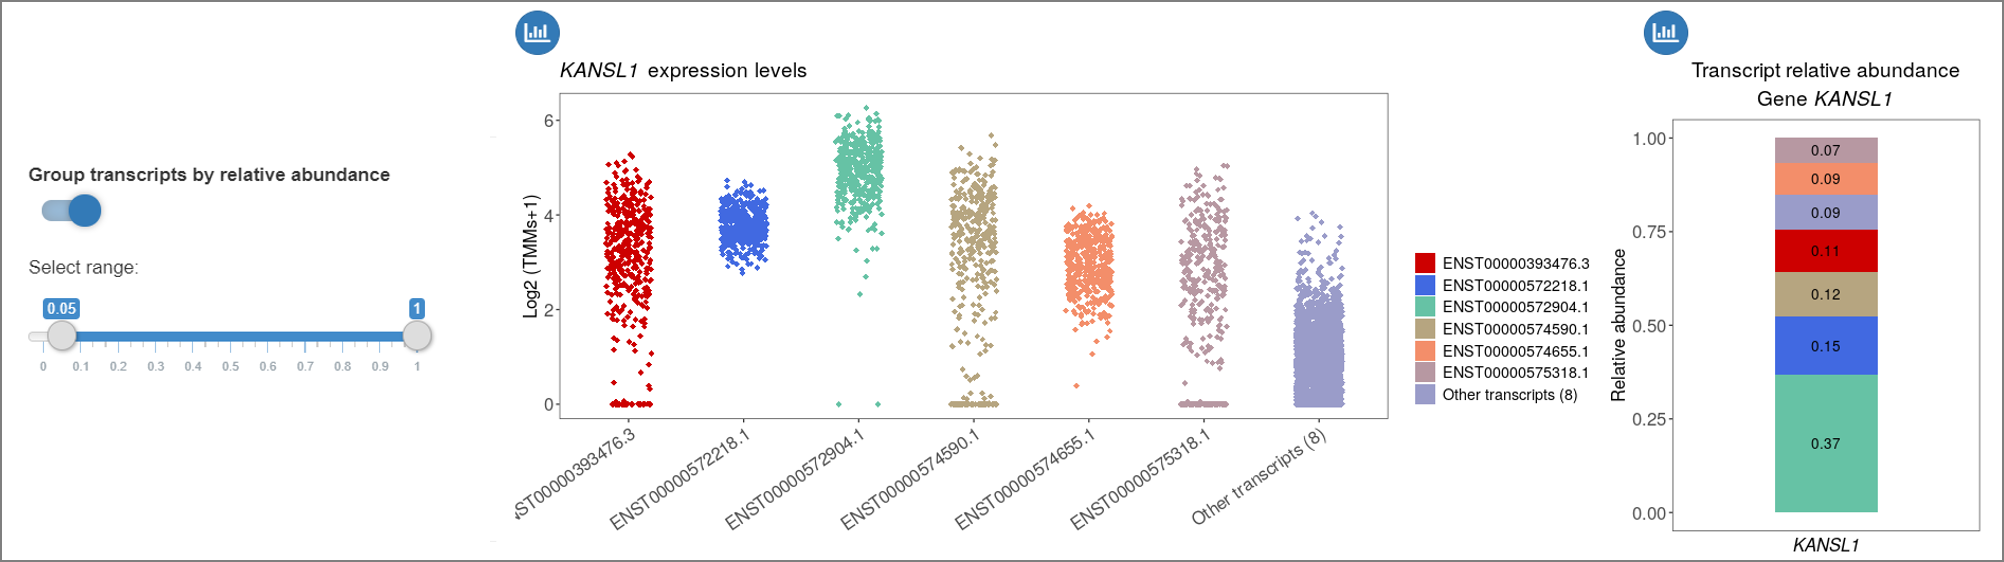
Different plots are displayed according to the options selected on the left panel.
For example, the 'Group transcripts by relative abundance' option may be used
to label low expressed transcripts as 'Other transcripts' at a defined threshold.
Example of transcript expression and relative abundance plots for the gene KANSL1,
where eight transcripts with relative abundance lower than 0.05 are grouped
in the 'Other transcripts' category.
QTLs tab
On the QTLs tab, users may explore QTL summary statistics and annotate SNPs of interest.
All e/sQTLs provided are cis-e/sQTLs and only include SNPs located within 1Mb of the corresponding gene transcription starting site (TSS).
The 'Explore e/sQTLs' option provides a descriptive table of the selected set of e/sQTLs.
Only those eQTLs passing the Q value cutoff of 5% are provided. The top eSNP (with lowest p value) for each eGene is provided.
Users may search for a gene/transcript/SNP of interest using the search box above the table.
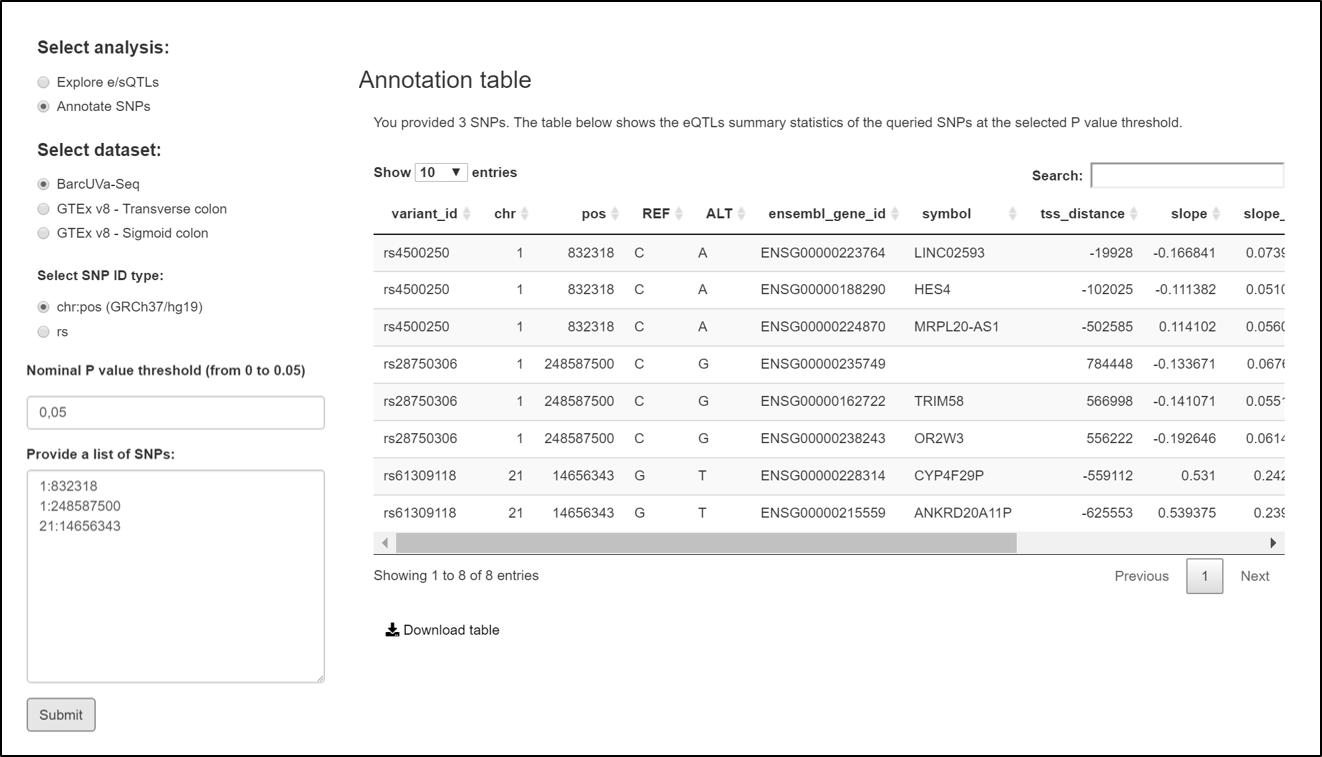
The 'Annotate SNPs' option allows generating eQTL summary statistics for a list of SNPs provided by the user at a defined P value threshold.
Please provide a list of up to 100 SNPs for ensuring a quick retrieval of results.
Example of query at the SNP annotation tool on QTLs tab showing BarcUVa-Seq eQTL statistics for three SNPs provided by the user.
Prediction models tab
On the 'Prediction models' tab users may select a data set to visualize the corresponding gene expression prediction models statistics.
For BarcUVA-Seq, models are provided for the entire colon and stratified by colon subsite. Please click on the row with the gene of interest to get the weights for each SNP included in its model.
Networks tab
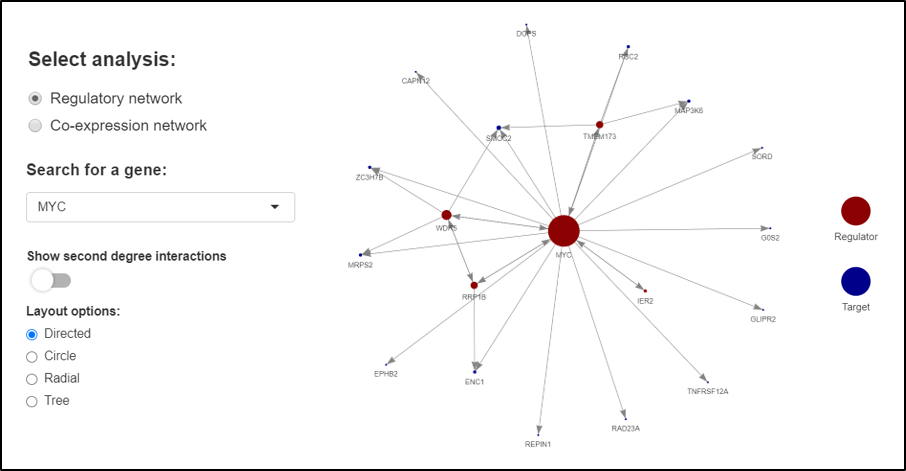
On the Networks tab, the regulatory network option allows searching for a given gene of interest to explore gene interactions between TFs and regulated genes.
It can be selected to display second degree interactions, as well as four different network layouts. Extended information about descriptive and
topological network parameters are provided in the tables.
Example of regulatory network for the MYC gene.
Methods
For BarcUVa-Seq data, SNP coordinates refer to the GRCh37/hg19 reference genome, SNP IDs refer to dbSNP version 142,
and gene IDs refer to the GENCODE release 19. For GTEx v8 data, SNP coordinates refer to the GRCh38/hg38 reference genome, SNP IDs refer to dbSNP version 151,
and gene IDs refer to the GENCODE release 26.
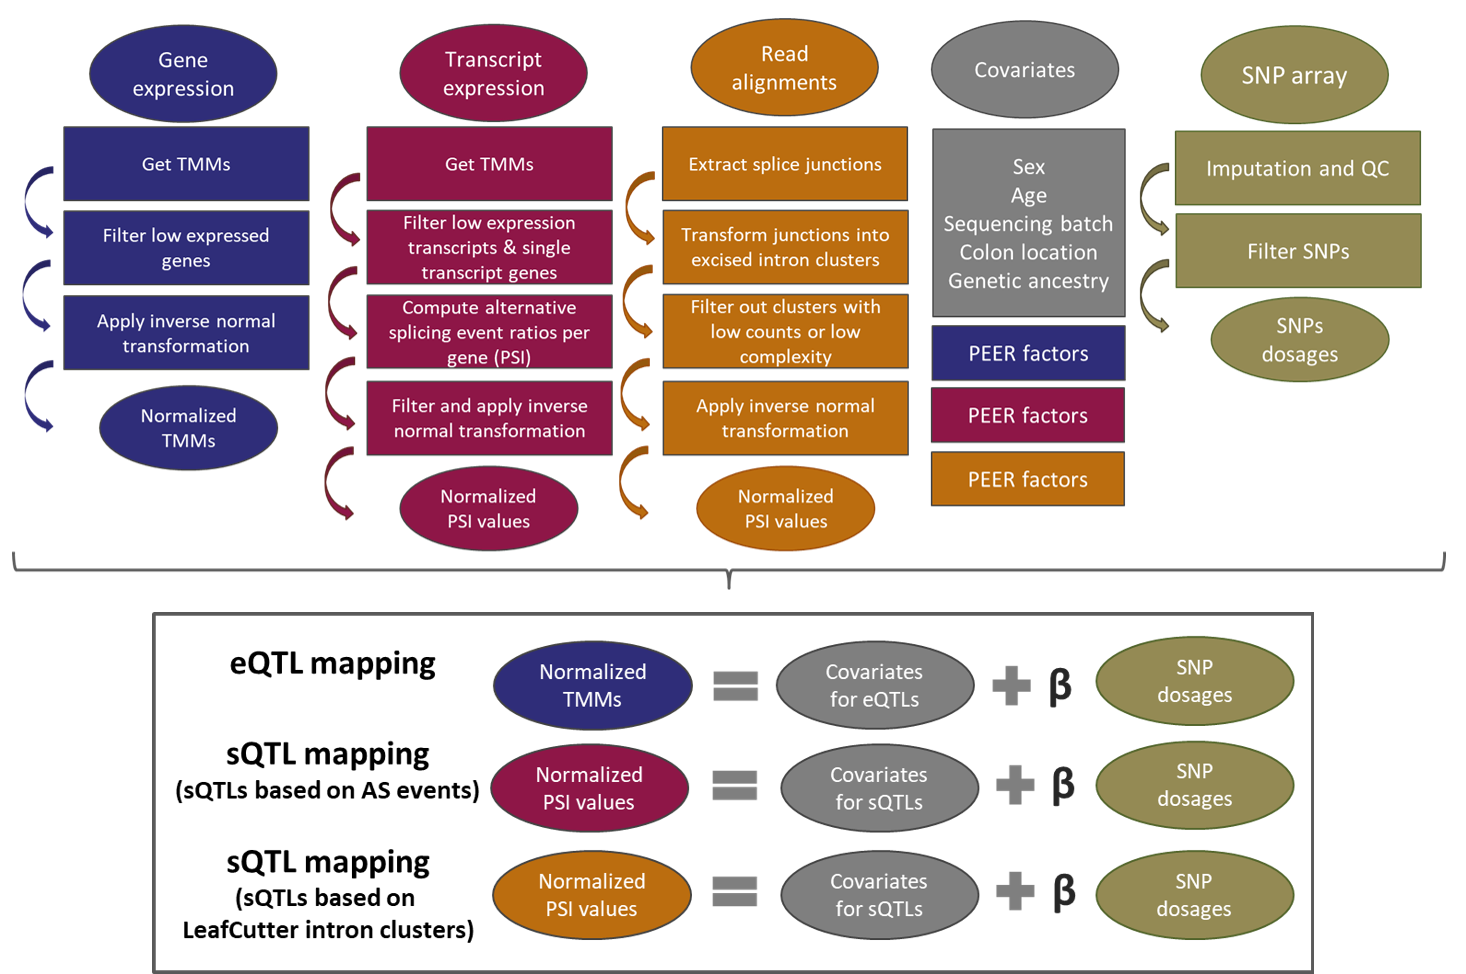
Only SNPs located within 1 Mb surrounding the gene transcription starting site are included in e/sQTL models.
Associations were obtained with FastQTL tool. Q value (Storey & Tibshirani procedure) statistic was computed with the R package qvalue.
Scheme of overall pipeline analysis for QTL identification in BarcUVa-Seq data.
Prediction models statistics provided at the 'Prediction models' tab are based on elastic net regression.
For BarcUVa-Seq, they were computed following the PredictDB pipeline.
According to this pipeline, only genes with a predictive performance R square greater than 0.01 and p value lower than 0.05 are provided.
Also, only SNPs within 1Mb of the corresponding gene TSS are included in the models.
GTEx v8 models were downloaded from PredictDB repository.
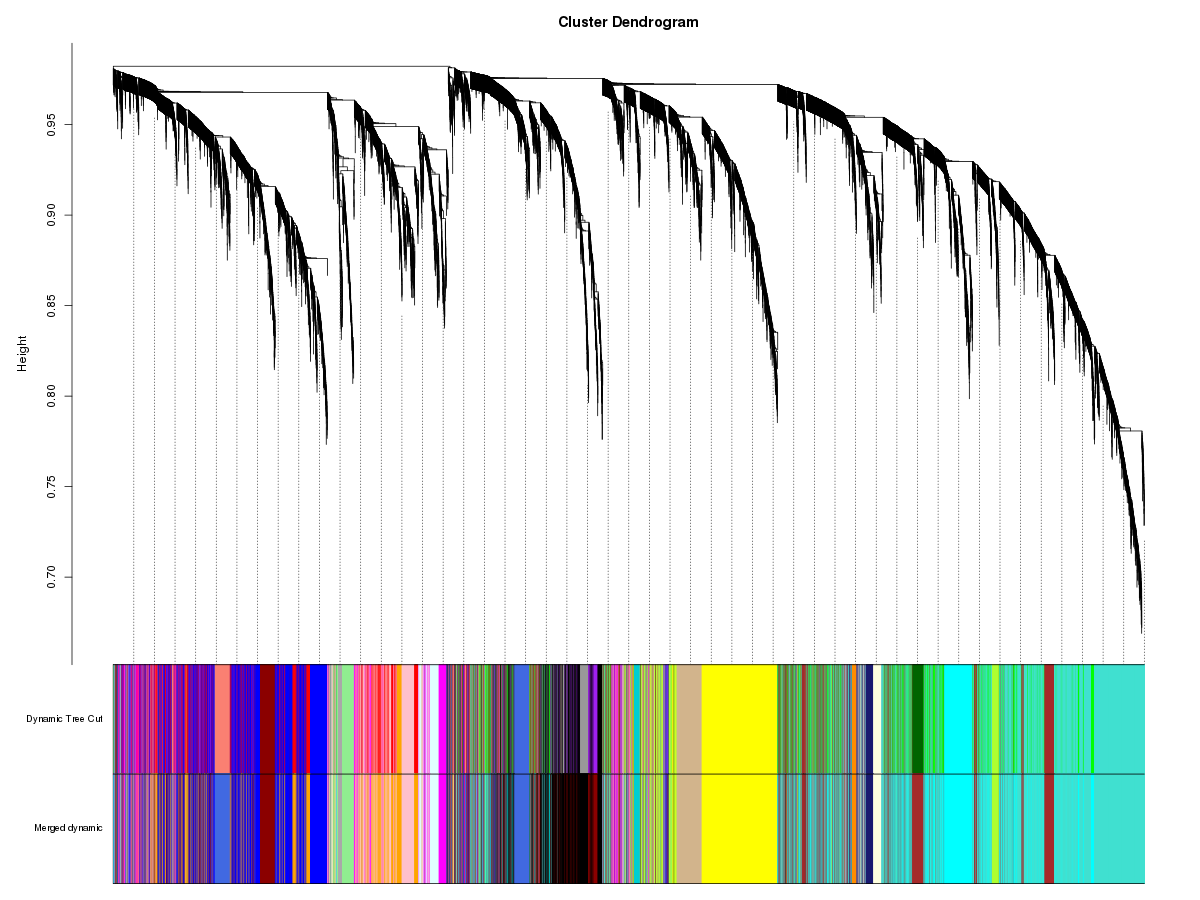
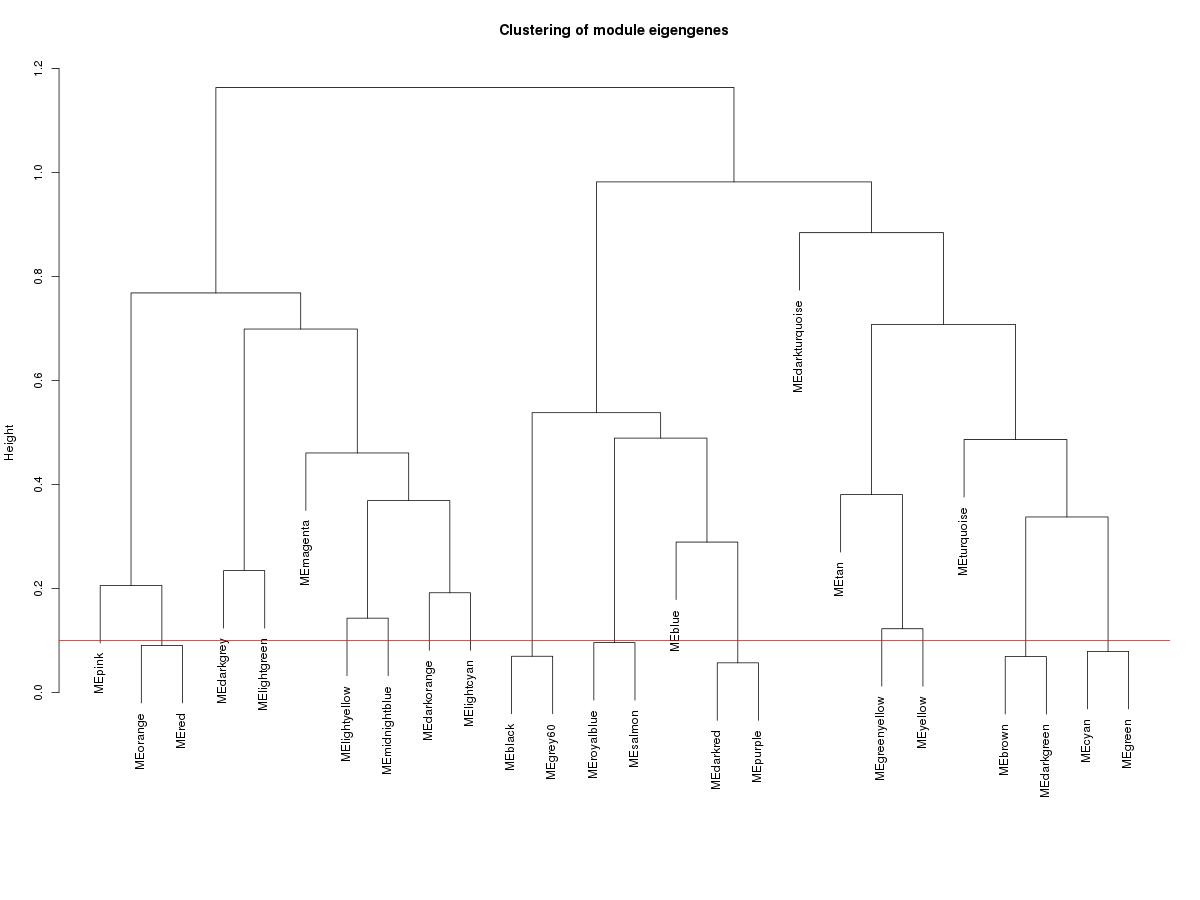
Bc3net R package was used for deriving weighted directed gene networks between Transcription Factors (TFs)
and their target genes. WGCNA R package was used for exploring correlated expression in a signed co-expression network.
References
Diez-Obrero et al. Genetic effects on transcriptome profiles in colon
epithelium provide functional insights for genetic risk loci. Cellular and Molecular Gastroenterology and Hepatology. 2021 Feb. DOI: 10.1016/j.jcmgh.2021.02.003.
GTEx Consortium. The GTEx Consortium atlas of genetic regulatory effects across human tissues. Science 2020;369(6509):1318-30.
Barbeira et al. GTEx v8 Elastic Net prediction models [Data set]. Widespread dose-dependent effects of RNA expression and splicing on complex diseases and traits. Zenodo 2019. http://doi.org/10.5281/zenodo.3519321
de Matos Simoes,R. and Emmert-Streib,F. (2012) Bagging statistical network inference from large-scale gene expression data. PLoS One, 7, e33624.
Langfelder,P. and Horvath,S. (2008) WGCNA: an R package for weighted correlation network analysis. BMC Bioinformatics, 9.
Citation
If you benefit from CoTrEx 2.0 please cite:
Díez-Obrero, V.; Moratalla-Navarro, F.; Dampier, C.; Devall, M.; Carreras-Torres, R.; Casey, G.; Moreno, V. The Colon Transcriptome Explorer (CoTrEx) 2.0: a Reference Web-Based Resource for Exploring Population-Based Normal Colon Gene Expression. Preprints 2021, 2021090349 (doi: 10.20944/preprints202109.0349.v1).
Support
CoTrEx 2.0 (2021) has been developed with funding from Instituto de Salud Carlos III, co-funded by FEDER funds –a way to build Europe– through the Consortium for Biomedical Research in Epidemiology and Public Health (CIBERESP). Also The National Institutes of Health grant R01CA201407.
Please, report any issue to 'cotrex @ odap-ico.org'